Building a Data-Driven Nonprofit Annual Report
Creating an annual report for a nonprofit organization is a task that requires keen attention to detail and a focus on presenting impactful results. These reports serve as a comprehensive review of the nonprofit’s activities, achievements, and overall impact over the past year. Beyond merely fulfilling a reporting requirement, an annual report is a valuable tool for storytelling, showcasing transparency, and engaging with stakeholders, including donors, volunteers, and supporters. Crafting a compelling, data-driven nonprofit annual report involves a blend of strategic planning, data visualization, and storytelling techniques. Here, we delve into the essential components of constructing an effective annual report that leverages actionable data to highlight a nonprofit’s impact.
The role of data in today’s digital landscape cannot be overstated, especially for nonprofit organizations. With the advent of AI-powered platforms such as DaanVeda, the process of gathering and analyzing vast amounts of data has become significantly easier and more effective. DaanVeda offers comprehensive data solutions that can inform and enhance annual reporting, giving nonprofits access to a wealth of information about donors, foundations, grants, and more.
To build a data-driven nonprofit annual report that resonates with your audience, consider the following strategies:
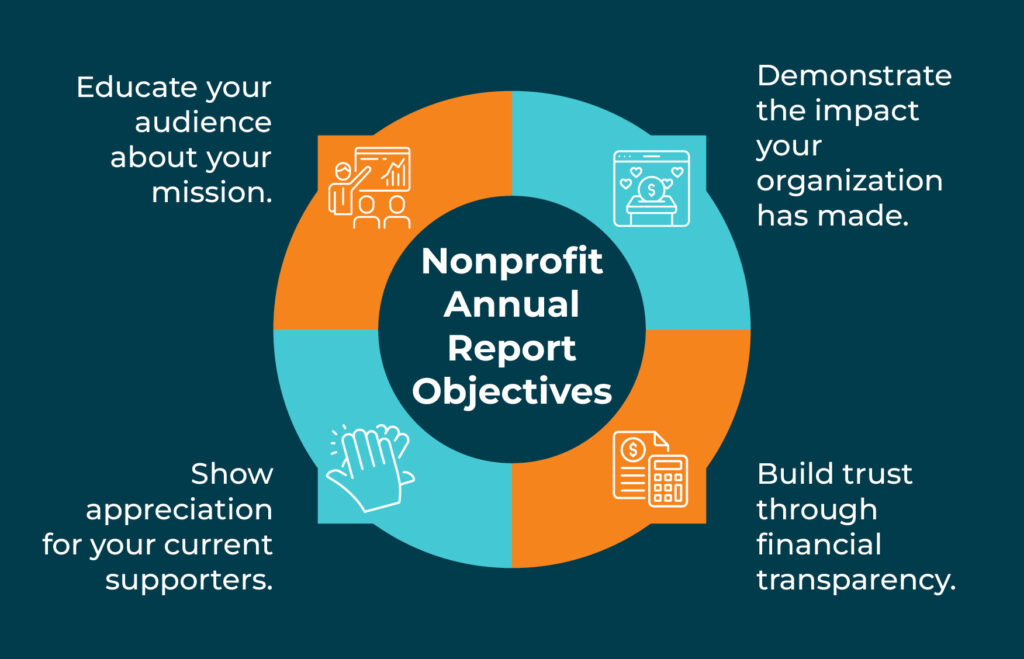
- Set Clear Objectives: Before diving into the data and writing, define what you hope to achieve with your annual report. Are you aiming to demonstrate transparency to your donors? Do you want to illustrate the impact of your programs? Are you looking to inspire greater involvement or donations? Clarifying your objectives will guide the structure and content of your report.
- Identify Key Metrics: Determine the most essential metrics that showcase your organization’s impact and align with your objectives. These could include the number of beneficiaries served, funds raised, program outcomes, volunteer hours contributed, and other significant achievements. It’s important to select metrics that not only quantify your impact but also resonate with your audience.
- Leverage Data Visualization: Visual elements such as graphs, charts, and infographics make data easier to understand and more engaging. Data visualization helps highlight key points and trends, making it easier for readers to grasp the significance of your achievements. Tools and platforms like DaanVeda can provide valuable insights and visualization capabilities to enhance your data presentation.
- Tell a Compelling Story: Beyond numbers and data, your annual report should tell a compelling story about your organization’s journey and impact. Use narratives to illustrate the real-world difference your nonprofit is making. Highlight individual stories of beneficiaries, volunteers, and staff to put a human face on your data and statistics.
- Ensure Transparency and Credibility: Transparency is crucial in building trust with your stakeholders. Provide clear and detailed explanations of your financials, including sources of funding, expenditures, and allocation of resources. Transparent reporting helps demonstrate your organization’s accountability and commitment to its mission.
- Engage with Visual and Interactive Elements: Incorporate multimedia elements such as videos, interactive charts, and photographs to convey your message more dynamically. Engage your readers through visually appealing and interactive content that keeps them interested and invested in your story.
- Organize Content for Readability: Structure your report in a logical and reader-friendly format. Use headings, subheadings, bullet points, and concise paragraphs to break up the text and make the information accessible. A well-organized report enhances readability and ensures that your key messages aren’t lost in dense blocks of text.
- Highlight Future Goals and Initiatives: While it’s important to reflect on past achievements, looking forward is equally crucial. Include sections that outline your future goals, upcoming projects, and strategic objectives. This not only gives your audience a sense of direction but also encourages continued involvement and support.
- Incorporate Stakeholder Feedback: Show your audience that you value their input by including testimonials and feedback from donors, beneficiaries, volunteers, and partners. Highlighting their perspectives can add credibility and reinforce the impact of your work.
- Conclude with a Strong Call to Action: End your report with a clear and compelling call to action. Whether it’s donating, volunteering, advocating, or spreading the word, guide your readers on how they can get involved and support your mission.
Integrating these strategies will help you create a data-driven nonprofit annual report that effectively communicates your impact and engages your stakeholders. With platforms like DaanVeda, compiling and analyzing the necessary data becomes more manageable, enabling nonprofits to create reports that are both informative and inspirational.
Setting Clear Objectives
The foundation of any effective annual report is a clear understanding of its purpose. Identifying your goals early in the process will help ensure that every piece of data and every story included in your report serves to reinforce your key messages. Ask yourself the following questions to define your report’s objectives:
- What are the primary achievements and impacts we want to highlight?
- Who is the target audience for this report? (e.g., donors, volunteers, partners, general public)
- What action do we want our readers to take after reading the report?
By answering these questions, you can tailor the content and focus of your report to align with your desired outcomes. These objectives will serve as a guiding framework throughout the report creation process.
Identifying Key Metrics
Once your objectives are clear, the next step is to identify the key performance indicators (KPIs) that will best demonstrate your organization’s impact. These metrics should be directly tied to your objectives and relevant to your audience. Consider the following types of metrics:
- Output Metrics: These measure the direct results of your activities, such as the number of people served, workshops conducted, or items distributed.
- Outcome Metrics: These assess the changes or benefits resulting from your activities, such as improvements in beneficiaries’ health, education, or quality of life.
- Financial Metrics: These provide insights into your organization’s financial health and efficiency, such as total funds raised, cost per beneficiary, and administrative costs as a percentage of total expenses.
- Engagement Metrics: These measure the involvement and satisfaction of your stakeholders, such as donor retention rates, volunteer hours, and stakeholder feedback scores.
Choose metrics that are not only quantitative but also qualitatively descriptive of your organization’s achievements. Utilizing DaanVeda’s vast database and analytics tools can help you gather relevant data efficiently and accurately, allowing you to select the most meaningful metrics for your report.
Leveraging Data Visualization
Data visualization is a powerful tool for transforming complex data into understandable and engaging visuals. By using graphs, charts, infographics, and other visual elements, you can highlight key trends and insights from your data in a way that is both accessible and impactful. Consider the following tips for effective data visualization:
- Simplicity: Avoid overcrowding your visuals with too much information. Focus on the most important data points and present them clearly.
- Consistency: Use consistent colors, fonts, and styles throughout your report to create a cohesive and professional look.
- Relevance: Ensure that each visualization directly supports the points you are making in your report. Avoid using visuals as mere decoration.
- Interactivity: If possible, incorporate interactive elements that allow readers to explore the data in more depth, such as clickable charts or embedded dashboards.
Using a platform like DaanVeda, you can access sophisticated data analytics and visualization tools that can help you create compelling visuals for your annual report.
Telling a Compelling Story
While data and metrics are crucial, they are most powerful when framed within the context of a compelling story. Your annual report should weave a narrative that connects the data to your mission, vision, and values. Consider incorporating the following storytelling elements:
- Personal Stories: Share the experiences of individual beneficiaries, volunteers, and staff to humanize your data and create an emotional connection with your readers.
- Case Studies: Highlight specific programs or initiatives that exemplify your organization’s impact. Use detailed case studies to illustrate how your work is making a difference.
- Quotes and Testimonials: Include direct quotes from stakeholders to add authenticity and credibility to your report.
- Challenges and Learnings: Be transparent about the challenges your organization has faced and the lessons learned. This demonstrates maturity and a commitment to continuous improvement.
By integrating these elements, you can create a narrative that not only informs but also inspires your audience.
Ensuring Transparency and Credibility
Transparency is a cornerstone of trust and credibility. Your annual report should provide a clear and honest account of your organization’s financials, operations, and outcomes. Consider including the following elements to ensure transparency:
- Financial Statements: Provide detailed financial statements, including income statements, balance sheets, and cash flow statements. Clearly explain any significant variances or trends.
- Funding Sources: Disclose the sources of your funding, including individual donations, grants, corporate sponsorships, and other revenue streams.
- Resource Allocation: Show how funds were allocated across different programs and operations. Break down expenses by category and provide context for significant expenditures.
- Governance and Accountability: Highlight your organization’s governance structure, including board members, leadership team, and key policies. Explain how you ensure accountability and ethical practices.
Being transparent not only builds trust with your stakeholders but also strengthens your organization’s reputation and credibility.
Engaging with Visual and Interactive Elements
In addition to data visualization, incorporating other visual and interactive elements can make your annual report more engaging and memorable. Consider using the following techniques:
- High-Quality Photographs: Use professional-quality photographs that capture the essence of your work and the people you serve.
- Videos: Embed short videos that highlight key achievements, share personal stories, or provide behind-the-scenes insights.
- Interactive Charts: Use interactive charts and graphs that allow readers to explore the data in more depth.
- Infographics: Create infographics that summarize complex data and information in a visually appealing way.
These elements not only enhance the visual appeal of your report but also make the content more interactive and engaging for your readers.
Organizing Content for Readability
Organizing your content in a logical and reader-friendly format is crucial for maintaining your audience’s attention. Consider the following tips for structuring your report:
- Clear Headings and Subheadings: Use clear and descriptive headings and subheadings to guide readers through the content.
- Bullet Points and Lists: Use bullet points and lists to break up dense text and highlight key points.
- Concise Paragraphs: Keep paragraphs concise and focused. Avoid lengthy blocks of text that can overwhelm readers.
- Table of Contents: Include a table of contents to help readers navigate the report easily.
- Executive Summary: Provide an executive summary that highlights the key points and achievements of the year.
A well-organized report is not only easier to read but also more effective in conveying your message.
Highlighting Future Goals and Initiatives
While reflecting on past achievements is important, it’s equally crucial to look forward and outline your future goals and initiatives. This not only gives your audience a sense of direction but also demonstrates your organization’s vision and commitment to continuous improvement. Consider including the following elements:
- Upcoming Projects: Highlight key projects and initiatives that are planned for the coming year.
- Strategic Objectives: Outline your organization’s strategic objectives and how you plan to achieve them.
- Innovation and Growth: Discuss areas where your organization is innovating and exploring new opportunities for growth.
- Calls to Action: Encourage readers to support your future goals through donations, volunteering, advocacy, or other forms of involvement.
Highlighting future goals and initiatives not only keeps your audience informed but also inspires them to continue supporting your mission.
Incorporating Stakeholder Feedback
Incorporating feedback from your stakeholders can add credibility and reinforce the impact of your work. Consider including the following elements:
- Donor Testimonials: Share testimonials from donors about why they support your organization and their satisfaction with how their contributions are being used.
- Beneficiary Stories: Include stories from beneficiaries about how your organization’s programs have positively impacted their lives.
- Volunteer Feedback: Highlight feedback from volunteers about their experiences and the value they see in contributing their time and skills.
- Partner Endorsements: Share endorsements from partners and collaborators who can attest to the effectiveness and impact of your work.
Incorporating stakeholder feedback not only adds credibility but also provides a well-rounded perspective on your organization’s impact.
Concluding with a Strong Call to Action
Finally, conclude your annual report with a strong and compelling call to action. Clearly articulate how readers can get involved and support your organization’s mission. Consider the following suggestions:
- Donation Opportunities: Highlight various ways readers can donate, including one-time donations, recurring donations, and planned giving.
- Volunteer Opportunities: Encourage readers to volunteer their time and skills to support your programs and initiatives.
- Advocacy: Invite readers to advocate for your cause by spreading the word, participating in campaigns, and engaging with policymakers.
- Stay Connected: Encourage readers to stay connected with your organization by subscribing to newsletters, following on social media, and attending events.
A strong call to action not only motivates readers to take the next step but also reinforces their sense of involvement and support for your mission.
In conclusion, creating a data-driven nonprofit annual report requires a strategic approach that combines clear objectives, relevant metrics, compelling storytelling, transparency, visual appeal, and stakeholder engagement. Leveraging AI-powered platforms like DaanVeda can enhance your ability to gather, analyze, and present data effectively, resulting in a report that not only informs but also inspires and engages your audience. As you embark on the journey of creating your annual report, remember that it is not just a document but a powerful tool for communicating your organization’s impact and vision to the world.
What strategies have you found most effective in creating impactful annual reports? How can DaanVeda’s solutions further enhance your annual reporting process? Share your thoughts and experiences in the comments below.